Today we take a look into an new index that measures human well-being, co-authored by the Co-Founders & Directors of Measure of America, Sarah Burd-Sharps and Kristen Lewis.
Measure of America has developed an index made up of health, education, and income indicators that measures well-being and access to opportunity in communities across the U.S. It goes beyond money metrics like Gross Domestic Product (GDP) to look at reality for everyday people. This American Human Development (HD) Index, presented along a simple ten-point scale, adapts the well-honed and widely-referenced Human Development Index designed at the United Nations, and has been applied to U.S. states, congressional districts, metro areas, counties, and neighborhoods as well as racial and ethnic groups, women and men, and the foreign- and native-born.
In the latest report, A Portrait of California 2014–2015, we bring together data, innovative analysis, and the American HD Index methodology to enable “apples-to-apples” comparisons of California’s counties, major cities, 265 Census Bureau–defined areas, women and men, and racial and ethnic groups. It provides a gauge of how different groups of Californians are doing, not just how the economy is doing, enabling different kinds of insights.
What kind of information does the HD Index provide that measures like GDP leave out? Here’s an example:
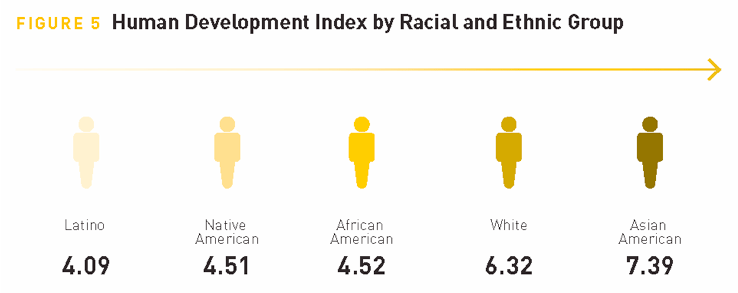
Californians live longer and earn more than the average American, but in parts of Los Angeles, the average life expectancy of a baby born today is on par with that of a baby born today in Libya or Sri Lanka, countries with far fewer resources for health care. In the state, Asian American men can expect to live a dozen years longer than African American men; adults living in central Los Angeles are 22 times as likely to lack a high school diploma as adults in nearby Pacific Palisades; and Latina women in California today earn about $18,000 per year, about what the typical American earned in 1960. On the overall ten-point Index scale, the Asian American well-being score is nearly twice as high as the Latino well-being score.
The Human Development Approach
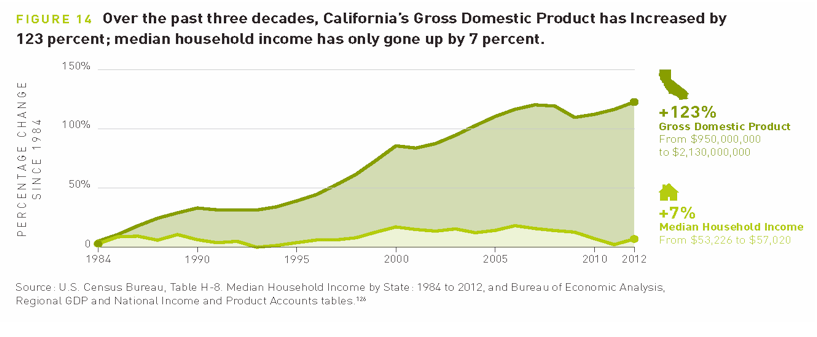
Gross Domestic Product and other money metrics are often used as a stand-in for how people are doing—but too often there’s a disconnect between what financial indicators are saying and what ordinary people are experiencing. We need a different kind of measure to tie data more closely to people and to help organizations use it for better decision-making to truly change lives. This is particularly important in an affluent economy like that of the U.S., where non-income inequalities are too often overlooked.
Investor and author Zachary Karabell catches the nuance here: “This yawning gap between what our numbers say and what most people feel is both extreme and increasingly unprecedented. For much of the 20th century, when the lattice of economic numbers painted a positive picture, that was reflected in how most people viewed their present and future—not because the numbers shaped their experience, but because the numbers represented it.”
Taken together, inequalities in health, education, and earnings divide California communities in ways that challenge conventional ways of seeing a state as a geographic area. By using the HD Index score to sort into neighborhood clusters (California has 265 of these Census-defined areas), we can actually define “Five Californias,” each with its own distinct well-being profile:
- One Percent California, HD Index score of 9.28, comprises the top one percent of the state’s population in terms of well-being. One out of three is foreign-born in this group. Adults in this category are highly educated, highly paid professionals fuelling the innovation economy and living primarily within six Santa Clara County towns;
- Elite Enclave California, HD Index score of 7.84, accounts for 15 percent of the state’s population. They are predominantly affluent, educated professionals who reside in upscale urban and suburban neighborhoods of the state’s major cities. The good schools, safety, cultural amenities, and neighborhood aesthetics that characterize this California come with a price tag that is out of reach to most people;
- Main Street California, HD Index score of 5.95, accounts for 39 percent of the state’s population. This group of Californians experience longer lives, higher levels of educational attainment, and higher earnings than the typical American. Main Street California is majority minority. Wages have remained flat for this group since the mid-1970s, forcing them to make trade-offs among necessities;
- Struggling California, HD Index score of 4.10, makes up 42 percent of the population across the state, from the suburbs, exurbs, and rural areas of the Central Valley to parts of major metro areas and the Inland Empire to swaths of Northern California. One in three children live in poverty; 37 percent of households with children are single-parent; and 18 percent of young people are neither working nor in school; and
- Disenfranchised Californians, HD Index score of 2.54, comprise the final 3 percent of residents. This group is largely excluded from the formal economy, and left behind in socially isolated and often stigmatized neighborhoods in Los Angeles and rural and urban areas in San Joaquin Valley. Seventy one percent are Latino; one out of three is foreign-born; and nearly half (48.5 percent) of children live in poverty. This population faces innumerable impediments to living freely chosen lives of dignity and fulfillment.
Note that almost fifty percent of Californians live in Struggling or Disenfranchised California. This is what human reality looks like. How can we apply this kind of data?
Closing The Data Loop
No magic here: The work of connecting data to action is in the trenches, collaborating with policymakers and people on the ground to apply the newly-obtained knowledge. Sonoma County is a recent case-in-point.
Measure of America released “A Portrait of Sonoma County” in May of 2014. The Sonoma Board of Supervisors voted in June 2014 to ban e-cigarettes, based in part on findings in the report that Sonoma’s adolescent smoking rates were high compared to its “peer counties.” The report was an impetus to redouble the county’s anti-smoking efforts.
Immediate opportunities like that are sometimes revealed with good data, but closing the data loop isn’t a transactional approach, but rather a daily process of embedding knowledge into decision-making infrastructure. The paradox, though, is that some of the early and positive data outputs can’t be counted.
Oscar Chavez of the Sonoma County Human Services Department, spoke directly to that point, noting that a critical output of the report was that it paved a way for sustained and uncomfortable conversations on poverty, race, health, and disparities to be held openly. Later, based on better understanding of the local connections between education, earnings, health, and inequality, the county authorized separate investments of $19.3mm and $50mm to make universal preschool a reality.
For Measure of America, closing the data loop means stimulating a fact-based conversation that focuses on outcomes. At that point, the work is to generate knowledge based on the data and be willing to use it to make decisions that matter to people’s lives.
Many thanks to the co-authors of this piece, Kristen Lewis and Sarah Burd-Sharps who are also the co-founders of Measure of America. Follow them on Twitter to keep track of the their data and in-depth analysis. Let us know what you think of their project in the comments below.
To stay up to date with the latest Markets For Good articles and news, sign up to our newsletter here. Make sure that you are also following us on Twitter.