Andrew Patricio of Data Effectiveness shares how self-service reporting can help you stop fighting data fires
Most organizations seek to focus the majority of their spending on programs and services, with the result that infrastructure like IT is often neglected. It can be difficult to see any advantages of investments in technology until after entire systems have been implemented and integrated, but the disadvantages of inefficient IT can negatively impact the organization as a whole.
This is especially true in the non-profit world because serious time, capacity, and budget constraints make it difficult to do the work today that will increase efficiency tomorrow.
For example, in the quest to become more data-driven, nonprofits often face technology bottlenecks due to the ever-increasing demand for actionable data. Our technical resources get bogged down managing existing systems and responding to immediate reporting needs.
Consequently, nonprofits are continually fighting fires because we didn’t have time 2 months ago to clear the brush that would have prevented the flare ups. One of these brush-clearing operations is self-service reporting, which allows analytics end users to pull high-quality data quickly and without the help of a technical expert.
Self-service reporting acts as a force multiplier for data teams by freeing up technical capacity for truly complex reporting needs and tool building. It also makes analytics more efficient because data teams have time for the truly useful “what if” conversations about data.
Here are four steps to self-service reporting that won’t overwhelm your immediate technical capacity and will give you a good return on your investment right away.
1) Preach to the converted
This is a key to success. While there is always a high demand for data across an organization, trying to implement a new system for all users at once is usually too ambitious.
Make your life easier by starting with people on the business/analytics side who are the most data savvy and open to change.

Once you identify these folks, involve them in the process so that they feel ownership of the end product. They are your requirements analysts, beta testers, and evangelists.
2) Don’t boil the ocean
Look at the various metrics and reports that have previously been created and identify two or three important or commonly requested metrics.
The idea is not to be innovative but rather to choose something familiar so that people can focus brain space on appreciating the process rather than understanding the data. We’re selling an approach, not an analysis.
The smoother the learning curve of the new self-service experiment, the more likely users will actually use it, and familiarity is a big piece of that. Familiar data and metrics that are immediately insightful – even if they are imperfect – will help you quickly build momentum and buy-in for your new system.
3) Create immediate value
Create a standard report in whatever form you are already using (e.g., Excel). This standard report will list the key metrics you identify along with any relevant variables, as in the example below.
Again, the goal here is utility, not perfection. To make this as effortless as possible, simply create a script that runs on a scheduled basis and dumps the data somewhere easily accessible like your organization’s file sharing platform.
Be sure to stay clear about business rule definitions. You want to be certain that people understand exactly what is and is not included in the data you are providing.
For example, in my former job at an urban school district we had a specific definition for truancy. Not all absence types counted against that. So we created two distinct absence count metrics – overall absences and absences that count against truancy – and made sure to include both in the report, drawing attention to the distinction.
At this point you’ve already lightened your reporting workload. But wait, there’s more!
4) Force multiply
Regularly updated standard reports are a good start, but they are only useful for the most current data. It’s hard to do any really interesting analytics without looking at multiple cuts of data.
You could go old-school and try to correlate data between all those Excel spreadsheets piling up each week (hint: the VLOOKUP formula!), but that process is tedious and you can only work with aggregations or very small individual samples across files.
But just because we’ve pulled data into excel doesn’t mean it has to stay there. By loading the reports back into a database, we can leverage the work we’ve already done without the expense and effort of a more formal data warehouse.
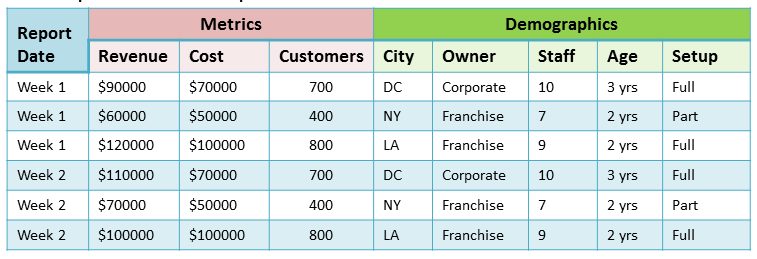
So, the final step is to set up a daily or weekly job to load a copy of each standard report into a set of database tables having the same row/column structure as the excel sheet but with the addition of a “report date” column, as in the example below.
Set up some kind of visualization tool or even just some simple SQL scripts and you’ve got a straightforward, powerful analytics tool. Not only that, you can also easily make “last year to date” vs “current year to date” comparisons in your regular reporting.
Once analytics and business users become comfortable looking at a standard report, you can create a system to easily analyze multiple pulls of these reports.
From “fighting fires” to “tending the forest”
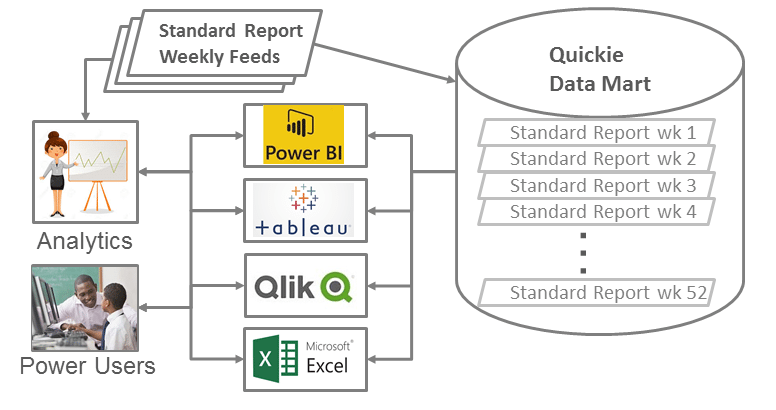
You can think of these standard reports as quick and simple “data marts,” and as pilots for a more formal, centralized data warehouse. Not only will they immediately provide richer data insights, they will start to build your organization’s data sophistication and help you discern what your true data needs are.
You’ll be surprised at how much use you can get from just this simple architecture. In many cases, it may be all you need.
Does your organization do self-service data reporting? What lessons have you learned? Chime in with a comment below. You can also connect with Andrew Patricio on Twitter or LinkedIn. Learn more about Data Effectiveness on their website.
To stay up to date with the latest from Markets For Good, sign up for our newsletter and follow us on Twitter. Better yet, become a contributor!