UK-based Data Orchard shares key lessons from producing its first online self-assessment and benchmarking tool.
In part one, I introduced you to Data Orchard’s online data maturity self-assessment and benchmarking tool. Here are four lessons we learned through the process of researching, designing, and testing the tool.
Lesson 1: Data Is Unpopular so Break It Down
You can’t underestimate how much people dislike data – and sometimes they have good reason. “A necessary evil.” “Dangerous, treacherous, powerful.” “Time-consuming exercise.” “I hate it!” These are some responses from charity staff and leaders when asked to describe how they feel about data. Most people aren’t very interested in data, and even fewer are familiar with data maturity. If you want to engage them, you’ll have to simplify the complexity.
We’ve learned that most social sector organizations are at an early stage of data maturity. Meaning, they are either just emerging or in the early days of their learning experience. In order to reach a wider audience, we needed to make our questions quick and relatively painless. So, we built a 5-minute version of our assessment for people who are short on time or interest—notably CEOs and other leaders.
Conversely, we also noticed a great deal of enthusiasm from a small but growing number of people—namely those in new data and analytics roles or working on impact and evaluation— who wanted full assessments. While it encouraged us to see these forward-looking leaders and practitioners thinking about the big picture, we also knew that attention spans for data were limited. So, we revised the questions and cut the assessment time in half—from 45 minutes to 20. We focused on ensuring questions were relevant to the nonprofit context and in a language that non-data people can relate to. We also completely re-wrote and re-designed the data maturity framework to breakdown the whole theory in less than 10 pages (it includes a glossary now too).
Lesson 2: Reaching Data Maturity Means Investing Time and Resources
Reaching data maturity is a long journey. The most data-advanced organizations we tested said that even after 8-10 years of experience with data, they were still working at it and expected to always be working at it. Examples include Joseph Rowntree Foundation’s 8-year journey in poverty data campaigning and building an in-house analytics team, and The Key, a small charity supporting young people in the North East transforming its services and impact through data (see CEO Hannah Underwood’s TEDx Talk).
We tested two support models aimed at accelerating data maturity in nonprofits, and conducted assessments at the beginning and end of a 12-month intervention. In short, a light touch diagnostic intervention can advance knowledge, skills, and understanding, and identify future priorities—though this in itself won’t shift the organization forward. An in-depth strategic intervention can make an impact and build an organization’s data capabilities in a measurable way. Doing this requires a considerable commitment of resources—in terms of staff and trustees’ time—and money for consultants and improving tools. For more about our support model interventions, read our case studies on Bracken Trust and The Cart Shed.
Lesson 3: Communicate in the Simplest and Most Beautiful Way
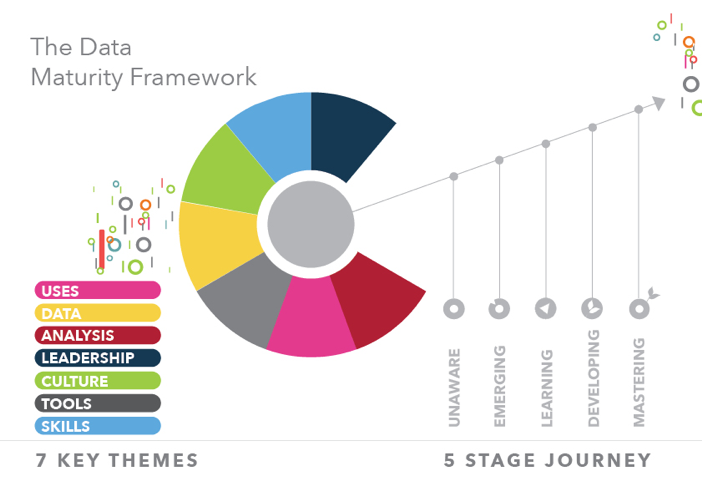
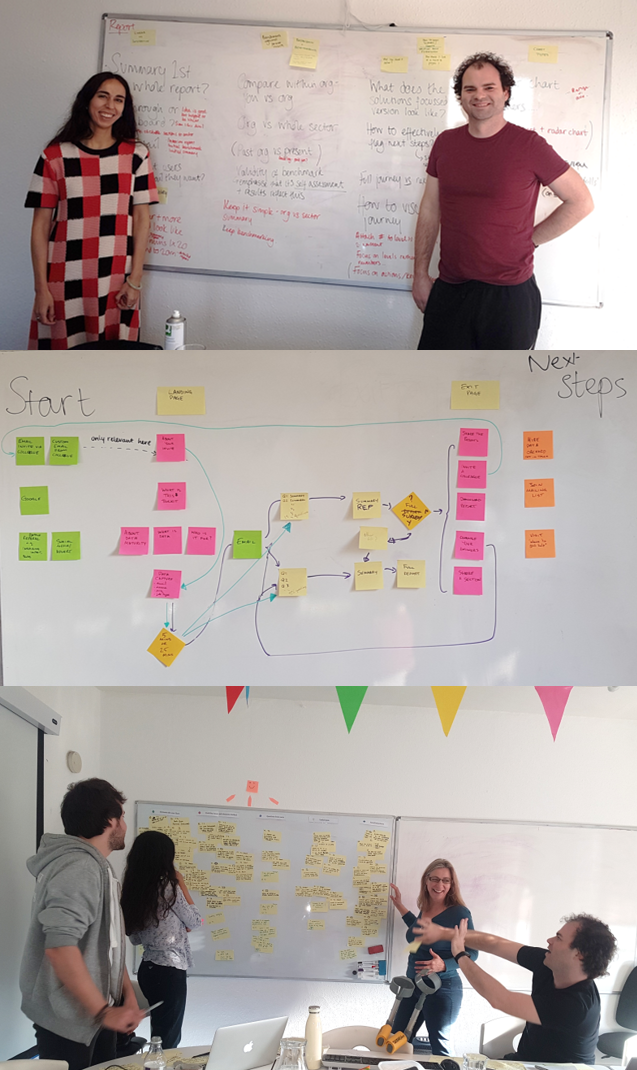
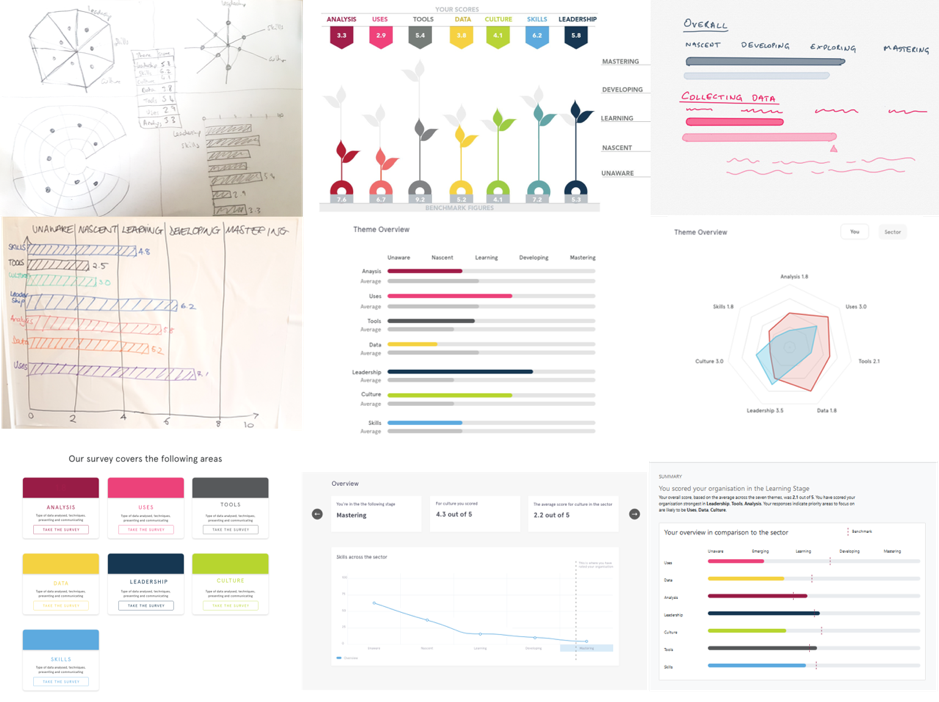
Our work with specialist advisors and three rounds of user research and testing were enlightening. We discovered hardly anyone knows what ‘nascent’ means, so we changed the name of the second stage of the data maturity journey to ’emerging’. We also learned most people either can’t understand a radar chart, can’t explain it easily to others, and/or don’t think their colleagues and leaders will understand one. So, we opted to use a simple bar-chart for presenting the results and scores in the online assessment report.
If you’ve got 5 stages it’s probably best to score on a scale of 1-5! Unsurprisingly it’s harder for people understand a score out of 10 when it’s related to a 5-stage scale. So, we changed our data maturity scores to be out of 5 instead of 10.
Helping people to learn is important. You don’t know what you don’t know, so having the ‘hover-over’ definitions in the assessment is really important. In user testing, one person who said they had a ‘data warehouse’ turned out to be referring to the archived boxes of paper in the office attic.
Make it quick. People who are interested in data and vaguely familiar with the concept of data maturity may have an attention span for a 20-minute assessment. For anyone else, five minutes may be the most you get. Finally, we were delighted to discover that people really do want benchmarking, though it’s best not to make it complicated.
Lesson 4: Watch the Ethics
The project also raised ethical and privacy issues. Since the assessment explores sensitive areas like data protection and security, organizations are potentially subject to negative publicity. The free online assessment results report deliberately omits the organization’s name. This way, there’s nothing to identify them should the email or results link be accidentally shared.
Our biggest challenge was about data sharing. First, it’s worth noting that while an individual may not have the answers to all of your questions, there’s a good chance that all of your questions will be answered if everyone is asked. The assessment has always been designed to be completed by multiple people across teams and departments, in order to provide a report on the whole organization. This is crucial in bringing different perspectives and providing a holistic and realistic view. People think about and use data very differently in organizations. We couldn’t assume that everyone would be fine with sharing their views, or that those who were fine with sharing would be valued and respected. We realized that we can’t make assumptions about an organization’s culture in an unmediated online context. Power dynamics could make trust and openness difficult.
So, we held off launching our whole organization online assessments until we had the privacy statements and legal data sharing agreements in place. Having since completed this work, we are now being hired by clients to set up customized online data maturity assessments for their nonprofits.
Next Steps
Even after five years working on this we know nothing is ever perfect or finished. We’re delighted to see the tool is being used by a good range of organization (by size, turnover, location, age, activity). Based on what we’ve learned from analyzing our first couple of hundred users we’ve already made some tweaks and improvements to the questions and benchmarking. The free tool will probably continue to be quite useful for smaller organizations. Meanwhile larger nonprofits, especially where there’s an in-house data champion, can already benefit from the more advanced features e.g. bespoke fields that enable analysis of data maturity by department or team type or location. Here’s a sample whole organization report for potential clients.
Some of our keenest users are other data support providers working in the nonprofit field. So, our next step is to explore how we can offer the tool to partners to support them in their work with charities. We’re also exploring how to make the assessment into more of an educational tool. We are currently crowdfunding to develop and test this functionality. In the meantime, we look forward to promoting the free online assessment tool as widely as possible and working with our Data4good partners to build a data savvy social sector.
How You Can Help
- Consider supporting Data Orchard as a partner, funder, or philanthropist.
- Join us on Twitter @Data_Orchard to learn more about our self-assessment tool and data maturity more broadly.
- Try the Data Orchard data maturity self-assessment tool and tell us what you think.
- If your organization would like to be data savvy but you don’t know where to start, please get in touch.
Many thanks to our funders—Digital Impact, the Esmee Fairbairn Foundation, and CAST; and to our project steering group—Anne Tregoning of Kindlemix, Suraj Vagdama of CAST, Giselle Cory of DataKind UK, Ben Proctor (then Satori Lab, now Data Orchard), and Caitlin Milne of Kindlemix.