Lauren Shaughnessy, Director of Measurement and Learning at Habitat for Humanity Greater San Francisco, shares her examples and ideas from her experience working with data in the nonprofit sector.
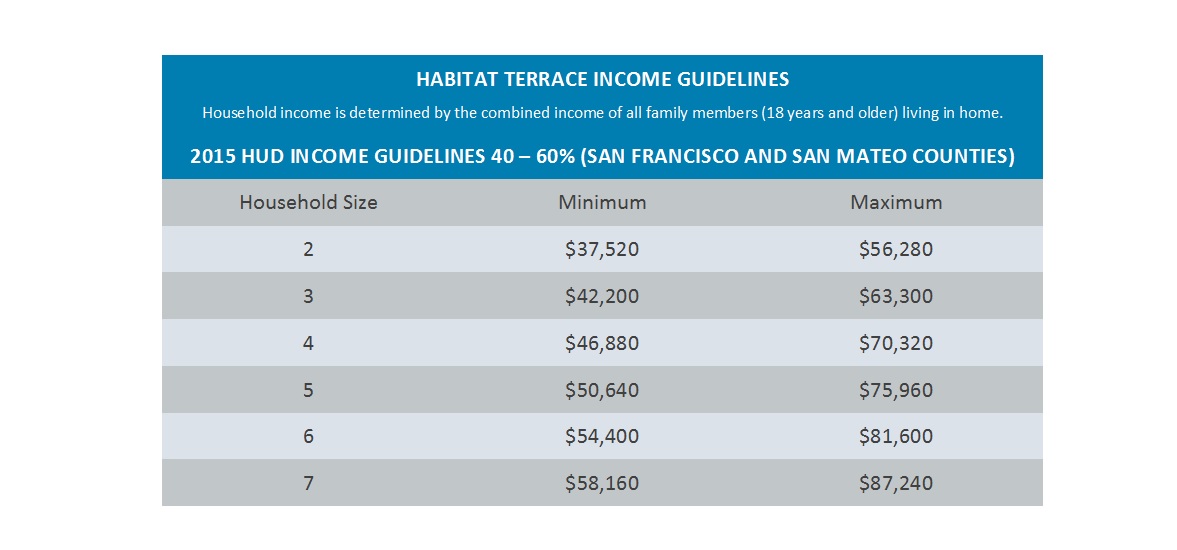
We’ve seen the headlines: the San Francisco Bay Area is experiencing a serious housing crisis. As of August 2015, San Francisco, San Mateo, and Marin counties had median home prices of $1.35 million, $1.3 million and $1.2 million, respectively. A buyer in these three counties would need to make between $230,000 to $270,000 annually to make the monthly payment on a single-family home.[1] For working families earning $37,000 to $87,000 annually, like those that Habitat for Humanity Greater San Francisco (GSF) serves, the dream of homeownership has become nearly impossible.
At Habitat for Humanity GSF, we work hard to strengthen communities, restore homes, revitalize local neighborhoods, and invest in our neighbor’s quest to become a homeowner. And just like the Bay Area housing crisis, a lot of people around the globe are familiar with Habitat for Humanity’s mission. This strong brand has many advantages. However, it can also make it difficult for our Greater San Francisco affiliate to communicate our local needs and impacts to stakeholders who already have preconceived notions of what Habitat is and what Habitat does. For an affiliate faced with finding inventive solutions to an extremely challenging market, we rely heavily on both qualitative and quantitative data to tell our story and help our community understand why this is a critical mission for them to join and support.
Putting Our Data in Context
A key starting place for us is often not with our own internal data, but rather external data that helps explain the environment we’re working within. For example, thanks to data from Berkeley’s Urban Displacement project, we were able to see whether our homes are located in census tracts at risk of displacing low-income individuals. We found that many of our units are in areas that have already undergone advanced gentrification, meaning our Habitat GSF homes are some of the last pockets of affordable ownership homes in these neighborhoods.
We also use data from the Census and the American Community Survey to understand how our Habitat homeowners compare to Bay Area homeownership and housing demographics. Data shows that our homes house larger families, with Habitat GSF homes in San Francisco housing five people on average compared to San Francisco’s average of 2.5 people. We also found that a greater percentage of our homes have children (Habitat GSF: 46% of households vs. San Francisco: 18% of households), and are more often a single female-headed household (Habitat GSF: 18% vs. San Francisco: 8%).
By employing external data across our program areas, we are able to more effectively communicate the importance of our program with those who might not know our model well or understand the context of the Bay Area.
Knowing What Data to Collect
In my time as a consultant, I came across a lot of non-profits that fell into the trap of collecting any data that was collectable. While the intention is great, the problem with this strategy is that you end up with a lot of random data points that may, or may not, result in a measurable way to track your actual impact. At Habitat GSF, we continue to work to avoid this by asking ourselves a few key questions:
- What impact are we holding ourselves accountable for creating?
- What data or evidence would we need to show to prove that impact occurred?
- Can we actually collect that data?
The answers to these questions can be translated into a formal theory of change or simply be a bulleted list of answers – The answers will serve as guiding posts for what data your organization should collect to track impact versus simply collecting because it’s interesting or currently available.
This issue became clear as we looked into the data we were collecting on our financial education program. Initially, we began surveying workshop participants about their financial habits after attending each workshop, 60 days after the workshop and again at 6 months. While this data was really interesting, we weren’t really sure what we were doing with it. So, we went through the exercise of answering “What impact are we holding ourselves accountable for creating?” which led us to find what we really wanted to accomplish. The purpose of our data collecting was to make sure our financial education participants were financially prepared to apply for Habitat homes. This meant we should adjust our data collection to simply tracking a few key indicators on a credit report before the class and six months after the class, and not asking several survey questions over multiple time periods. Introducing this discipline to our data collection approach allowed us to simplify and zero-in on what matters most for impact tracking.
Making Data Usable and Accessible
When it comes to storing and analyzing your data, success really comes down to systems, systems, systems! I cannot overemphasize how implementing better systems will transform your ability to accomplish effective data measurement. I’m sure anyone reading this piece knows the frustration of trying to work from a myriad of Excel spreadsheets, outdated Access database, paper files, and more just to piece together a simple data request. Not only is this a frustrating, error-prone way to store data, it’s also a drain on valuable staff time.
At Habitat GSF, we recently invested in a Salesforce instance known as HomeKeeper that is specifically designed for affordable homeownership programs. Answers to simple questions such as “How many children have moved into our homes?” were virtually impossible for us to answer because all the data lived in paper or Excel files. Having migrated all of our homeownership data into Salesforce, we are now able to ask more complex questions like, “What kind of overlap are we seeing between our financial education classes and who ultimately applies for our homes? In terms of readiness for homeownership, how does that population compare to those who don’t attend our classes?” Being able to answer more sophisticated questions that get at our desired impact is entirely made possible to the systems that now allow us to better analyze our own data.
While the answer for your organization doesn’t necessarily have to be Salesforce, I think it’s important for every organization to think critically about their system needs with regard to data collection and the impact you want your programs to make. Forget the idea that investing in this type of resource is “overhead,” and think about it as a necessary part of business.
Knowing How to Bring in the Qualitative
With the investment we’ve made in collecting relevant data with more rigor, we are now at a place where we can more powerfully combine our quantitative data with our already strong qualitative data. Knowing when and how to combine these two can present an interesting challenge, as it is more art than science.
A recent example for us involves an effort we have underway to survey our 200+ homeowners. For years we have been sharing stories that homeownership leads to more civic engagement, improved or increased education opportunity, and healthier families, amongst other positive benefits. However, most of these stories come from individual family anecdotes. What would be really powerful is if we could tell the individual story of a family while also being able to say “…and 85% of our families have experienced benefits just like Family X.” To be able to say that requires collecting data in a mindful way that helps support (or potentially refute) the powerful individual stories of impact.
We certainly don’t have it all figured out, yet. But I feel proud of the work we are doing to bring quantitative and qualitative data together to tell powerful stories of impact. Using quantitative data alone misses the storytelling aspect that appeals to the stakeholders’ emotional side. While qualitative data alone leaves you wondering if a single anecdote can be generalized for the whole population. Weaving the two together allows us to tell our full story of impact in a compelling and meaningful way.
To learn more about Habitat for Humanity Greater San Francisco, visit their website here and follow them on Twitter at @habitatgsf.
[1] California Association of Realtors Traditional Housing Affordability Index; Q2 2015 http://www.car.org/newsstand/newsreleases/2015releases/2q2015hai?view=Standard
To stay up to date with the latest Markets For Good articles and news, sign up for our newsletter here. Make sure that you are also following us on Twitter.