 The following post begins a new series: Notes From The Field. Here, we will take a look at various initiatives and organizations, or applications and tools on the landscape of the information infrastructure. We start with Elizabeth Clay Roy, Deputy Director of Opportunity Nation, discussing the “Opportunity Index.” If there is such thing as a widow “of” opportunity, then perhaps we could see the Index as a window “into” it. Calculated primarily from open federal data (the American Community Survey of the U.S. Census Bureau), the Index highlights the levers that people and communities can directly influence to improve economic mobility.
We talk about America as a land of opportunity, but in the social sector we know we work in thousands of lands within one country. Different counties, school districts, and zip codes criss-cross economic hubs and food deserts. A historically mobile nation, both geographically and economically, we understand that location matters, but we haven’t always investigated how it matters.
How might good geographic data and maps inform a conversation about an idea as big as “opportunity?” The Opportunity Index, a central component of the Opportunity Nation campaign attempts to do ju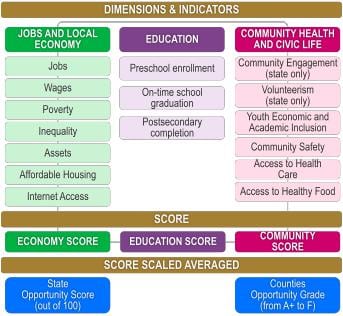 st that.
At the core of the Opportunity Nation campaign is the idea that, in America, the circumstances of your birth or the community in which you grow up should not condemn you to an inescapable economic fate. We talk a lot about the challenges we face as a nation: the jobs crisis, persistent poverty, failing schools, and more. And we know the potential waiting to emerge when all our friends and neighbors find work and have the skills to succeed. But we also know from experience that the ladder of opportunity in some communities has stronger rungs than others – safe communities to go to school, schools that prepare you to graduate and build a career, decent wages to help you afford a home.
That is why we developed the Opportunity Index in 2011 – to assess the strength of these various rungs. Developed in partnership with Measure of America, the Index measures the conditions in different communities that constrain or expand opportunity.
Unlike personal characteristics, which also have an impact on mobility, these factors are amenable to policy change and to collective efforts to bring about improvements for a community’s residents.
We use data from sixteen indicators to derive an Opportunity Score, a comprehensive snapshot of where a community stands today and how it can improve its future. The Index is updated annually to show trends and enable policymakers and citizens to better understand the progress of their communities.
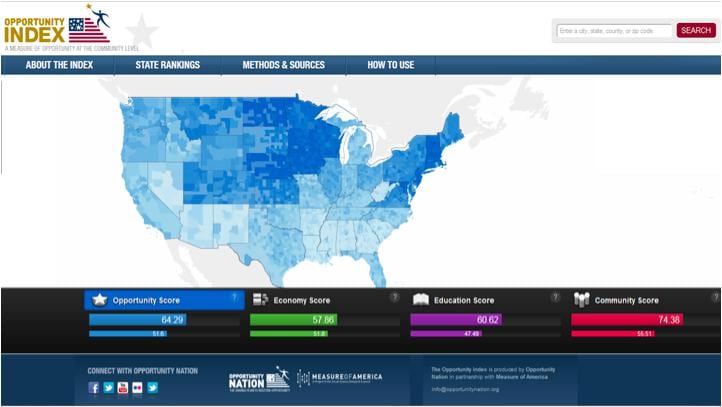
Geographically, we have found that the Northeast and Midwest dominate the highest ranks of state scores: the top ten states are split evenly between those two regions. The sixteen Southern states are disproportionately represented in the bottom of the ranking, while the eleven Western states largely occupy the middle to lower-middle rankings.
Many people associate opportunity with jobs and wages – however, neither unemployment rate nor median household income are among the indicators that correlate most strongly with higher opportunity scores.
The top three states in the 2012 Index are Vermont, North Dakota, and Minnesota. Interestingly, none of these three states are among the wealthiest as measured by income, yet they excel in many other important qualities. They have some of the lowest unemployment and poverty rates, very few disconnected youth and high graduation rates, and high concentrations of primary care providers.
The indicator with the strongest correlation with a state’s opportunity score is percentage of youth who are not in school or employed. And there are drastic differences between states and counties on this point. In Apache, Arizona, nearly 1 in 3 young people are disconnected from school and work, compared to 1 in 50 in Dallas County, Iowa. 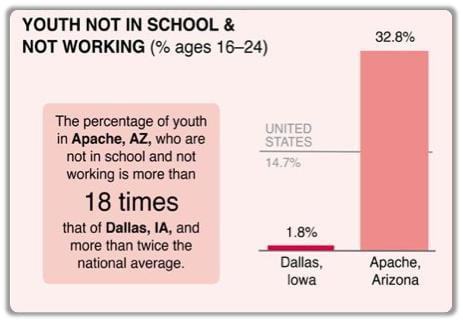
Opportunity Nation is a coalition of hundreds of partners and citizens aiming to increase opportunity in America. In-depth data practice is a critical tool for us, and most importantly, a catalyst for action. Local and state scores across the country have inspired and demanded new partnerships to work together an increase opportunity scores from Iowa, Minnesota, Arkansas, Massachusetts and more are emerging each week. National scores are valuable for foundations, businesses, media and federal government to inform their strategy for investments in education, economic renewal and healthy communities.
Without this level of data, information, and analysis a typical conversation about opportunity in a community might focus on a single factor, and miss the broader, interconnected picture.
This conversation could easily ignore the needs and challenges of those without a political voice. Or, it could stagnate with disagreements about which obstacles to opportunity are really holding the community back, or around the false but powerful idea that income is everything. The Opportunity Index helps those of us working for social change to see the big picture of an Opportunity Nation, and work together to build it.