The latest in our 'Between The Dashboard And The Chair' series, Beth Kanter's regular column here at Markets For Good.
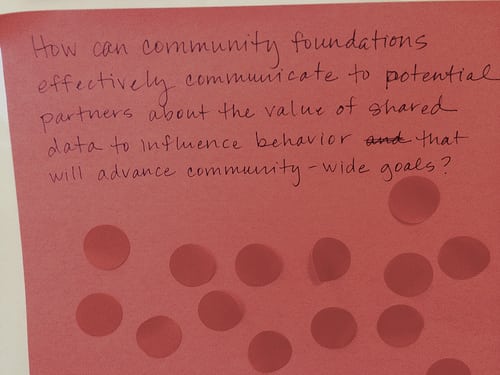
In May, I was lucky enough to spend a few days with community foundations at the annual GuideStar DonorEdge Learning Conference where I facilitated a mini-innovation lab to brainstorm creative ideas around the challenge of communicating about the value of shared data and becoming the community knowledge center for shared data for donors, nonprofits, and other stakeholders. The lab used human design facilitation techniques that I have been trained on by Luma Institute.
We started the lab with an exercise to gain individual understanding of the problems, a technique called Rose, Bud, Thorn (described here). Participants were challenged with an active listening exercise while two peers gave presentations on their work with data. We heard from Christina Ciociola, Community Foundation for Greater New Haven and what they have learned about using data from Donor Edge to become the community knowledge center over the past few years. We also heard from Priscilla Enriquez from the Sacramento Region Community Foundation about challenges and successes of getting started in best practices for data for good.
Next I used some group brainstorming techniques that allowed the group to generate lots of ideas collectively and then a process of synthesis where five teams worked on developing one concept, which they then shared with the group. I was blown away! Here’s what emerged:

Team 1: “Know Your Community: 5 in 10.”
This campaign melded multiple ideas for a mashup and multiple dimension, campaign approach. The campaign would have a media partner and “Media Day.” The campaign included creating nonprofit impact videos and stories based on issue areas, such as land use, violence, obesity, volunteerism, etc. The videos and stories would be shared by social media and multiple channels and would also be available on the DonorEdge site. One issue would be highlighted every month. The campaign would include a billboard as a teaser to drive traffic to the DonorEdge site. The “5 in 10” tag line reflected how donors could learn through videos and stories about 5 nonprofit issue areas in 10 minutes.
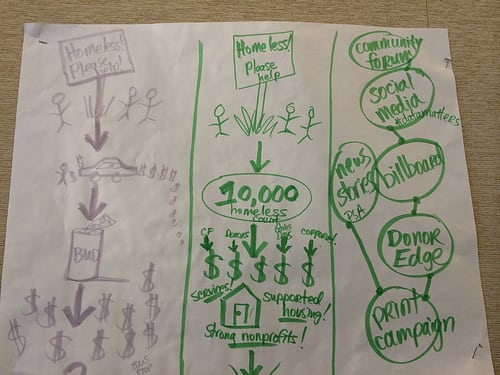
Team 2: “Heart vs. Head.”
This campaign would select one hot issue in the community and then use data (“head”) vs. no data (“heart”) to demonstrate the effectiveness of decision making and solving a problem using data vs. no data.
Example using the issue of homelessness:
First, use an infographic, picture, or video of homeless people begging for money from drive-by cars or pedestrians. Show how “heart-driven” donations may be spent on beer/alcohol and misused by the homeless. Describe how tax payer’s money is wasted and that the homeless people remained homeless, continuing to seek shelter at bus stops. (No solution).
Next use an infographic, picture, or video of homeless people. Use data (“head-driven”) to indicate the known number of homeless. Describe how donors, the community foundation, giving days, corporate community, and other funders can work strategically, based on data, with strong nonprofits to provide services and housing for the homeless. Using data and collaboration, the homeless receive the shelter and care they need, resulting in significantly reduced homeless population, i.e. from 10,000 to 2,000.
The campaign would be promoted through community forums, social media (hashtag #datamatters), news stories, public service announcements, billboards, print campaign, and DonorEdge profiles
“Head vs. Heart” won for best detail. The presentation contained components of including infographics, theory of change, customization using the data, and the campaign was easily shareable.
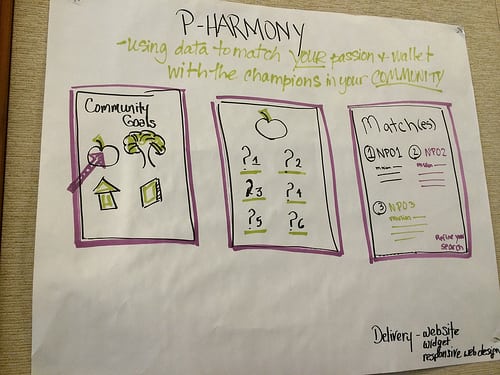
Team 3: “P-Harmony: Using Data to Match Your Passion and Wallet with the Champions in Your Community.”
This idea is based on the online dating site, “E Harmony.” The campaign would match individual passion and wallets with nonprofits. The campaign would begin by communicating community goals on issues, such as nutrition, environment, education, and housing. Next, nonprofits would submit data and stories about how they are tackling the issues on which they are working. The DonorEdge site would display a search filter that asked the donor (DonorEdge site visitor) questions to identify and match nonprofit profiles (data and stories) to the donor’s interest. The donor could continue to refine his or her search results to find the best nonprofit “match.” The donor’s final search results would display infographics and tell the nonprofit’s story of impact using the nonprofit’s data. The campaign would be delivered using the DonorEdge website, widgets, and responsive web design.
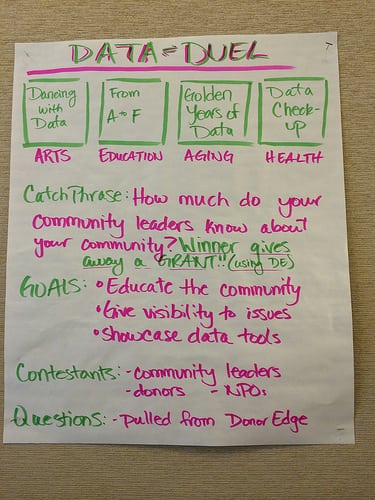
Team 4: “Data Duel: Nonprofit Jeopardy.” Luis Sosa, presenter
This campaign was based on the game, Jeopardy. (Jeopardy theme song played in background during the presentation). The categories of “Nonprofit Jeopardy” were based on issue areas such as:
- “Dancing with Data” (Arts)
- “From A to F” (Education)
- “Golden Years of Data (Aging)
- “Data Check-up” (Health
The catch phrase of the campaign was, “How much do your community leaders know about your community?” The mayor, city councilmen, community leaders, donors, and nonprofits, would be invited to play “live” in studio. The winner would give a grant to the nonprofit of his or her choice.
The Jeopardy questions would be based on nonprofit data in the DonorEdge site. The community at large could play the game via a mobile app, digital game, and other social media channels.
The goals of the campaign were to:
- Educate the community
- Give visibility to issues
- Showcase data tools
“Data Duel” won for best concept because the gamification made it fun. The campaign used a community wide engagement approach, it was “live” in studio, and had multiple distribution channels of DonorEdge, an App, digital game, and social media.
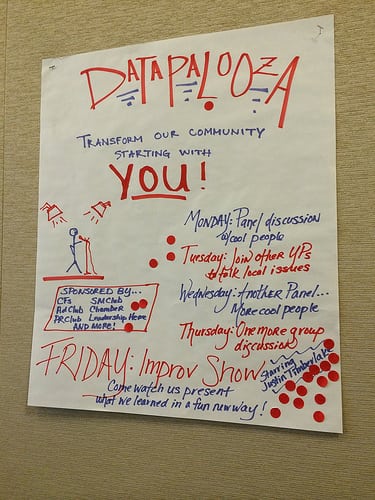
Team 5: Datapalooza: Transform our Community Starting with You!” Sutton Mora Hayes, presenter
This campaign was a five day series of events, with Days 1-4 designed to generate excitement for the culminating event on Day Five. Each day’s events and promotions would be based on feedback loops from the previous day(s). A diverse audience of young professionals and different civic or social clubs would be engaged for panel discussions. The campaign would be sponsored by the community foundation, Ad Clubs, PR Clubs, SM Clubs, Chamber of Commerce, Civic Leadership, and others. A global celebrity, such as Justin Bieber or Justin Timberlake (whoever is available!), would appear in person to draw attention to the campaign.
Example schedule:
- Monday: Panel discussion with famous, important, cool people
- Tuesday: Invitation for young professionals to talk about local issues
- Wednesday: Panel discussion with more famous, important, cool people
- Thursday: One more group discussion
Conclusion
The concept of using shared data to solve community issues is a fairly new idea in the nonprofit and philanthropy space and community. As such, communicating the value to donors, nonprofits, and community leaders is still a challenge for many community foundations. However, gaining shared understanding and collective brainstorming from peers can lead to innovative ideas for a communications strategy that can help everyone use data for better decision-making that leads to results.
Let us know what you think about Beth’s examples and questions. Comment below or tweet Beth and the Markets For Good team directly.