Audrée Lapierre, creative director of FFunction, gives an inside look at the collaborative work by FFunction to bring life and visualization to data based on nutrition, health, climate change, and early learning.
It’s been said before: if big data is about machines, then small data is about people. By their very nature, small data are accessible, informative and actionable—all useful things to have in your toolbox if you communicate around social good. These days I find a lot of small organizations are feeling the pressure to come up with big data and do something with it—anything—but most of the time it’s actually far more compelling (and frankly, useful) to dig up small datasets and use them as the backbone of a narrative.
One of our clients is the Children’s Investment Fund Foundation (CIFF), an independent philanthropic organization headquartered in London with offices in Nairobi and New Delhi. The organization works with a wide range of partners to address problems including nutrition, health, climate change, and early learning—transforming the lives of poor and vulnerable children in developing countries.
CIFF had five reports that they wanted to publish around their strategic priorities; Health, Nutrition, Education, Deworming and Climate Change. They originally asked FFunction to create a series of infographics summarizing the information that would then link to the reports and be pushed out on social media.
The project would also do double duty as an internal communications tool, according to Matt Gould, digital manager of CIFF, one that would “help CIFF’s staff connect to the amazing work they, and our grantees, do every day.”
The problem was that CIFF’s report data was simple—in certain parts too simple to create complex aggregate-based visualizations like some of FFunction’s previous projects for UNESCO or HP.
We suggested a different approach: create a scrollable interactive with pit-stops at every phase of life and the challenges along the way, providing links to CIFF’s work in that particular area. The interactive needed to provide an entryway to the reports, be emotive and engaging, AND needed to work seamlessly across desktop, tablet, and mobile.
We had to play around with some concepts.
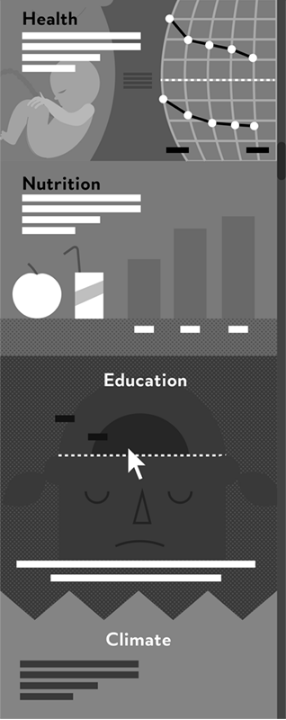
Concepts in black and white
STYLE
Wim Bruyninckx is FFunction’s Art Director, and he crafted all the illustrative elements of the CIFF project. Together with CIFF, we decided to create a character that the user would witness growing up during the course of the interactive. This girl would encounter all the issues CIFF needed to communicate—health, nutrition, education, deworming, and climate change—at various stages of her life.
CIFF began crafting a narrative and language that would echo a child’s nursery rhyme and create a symbiosis with the illustration style Wim was developing for the character.
As for the look and feel, we needed her to represent girls in Africa, Asia, Latin America, the Pacific, the Arab States, and Eastern Europe, so her characteristics and appearance had to be something not too specific. Essentially, she needed to be a universal figure to represent girls everywhere and the challenges they face. Her name? Beattie.
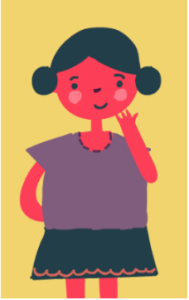
Meet Beattie, the girl shouldering the weight of small data gathered from around the world.
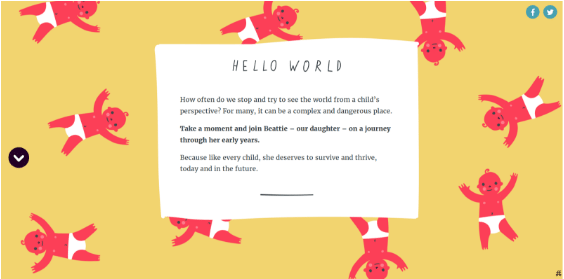
The intro of Beattie’s story. Note the simple rhyming language.
“I wanted to create an aesthetic that was organic, hand-crafted…childlike even,” Wim explains. To achieve this, every aspect was hand-drawn and then put into Vector for animating. We even created a custom typeface for Beattie’s Story.
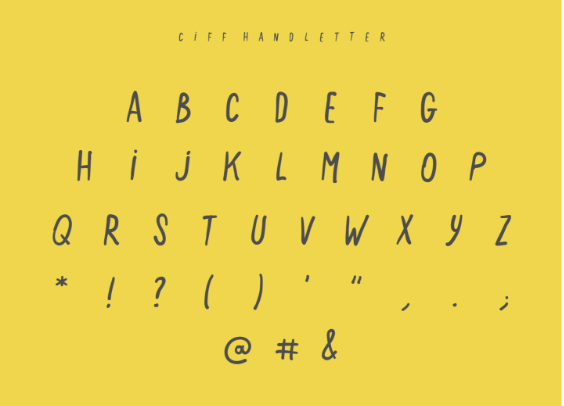
Beattie’s font.
“I found the combination of scientific data with poetic rhyme so interesting, and something I hadn’t really seen before,” says Wim.
The main challenge was a technical one: making each section functional in terms of visualizing the data, and making the character transition smoothly from scroll to scroll.
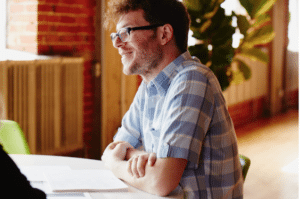
Our Art Director, Wim, here in FFunction’s studio in Montreal.
TEEN PREGNANCIES
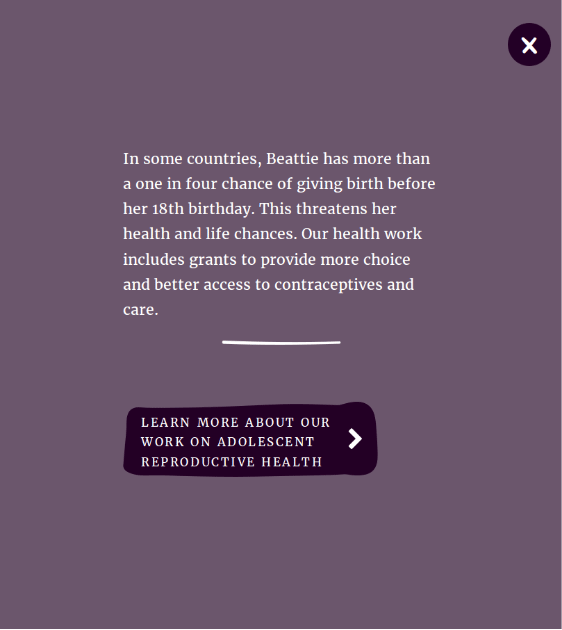
One of CIFF’s strategic priorities is Adolescent Contraception, and they work with partners across the developing world to promote access to reproductive health/education and safe contraceptive methods.
Here’s the intro panel for the Adolescent Contraception part of the interactive:
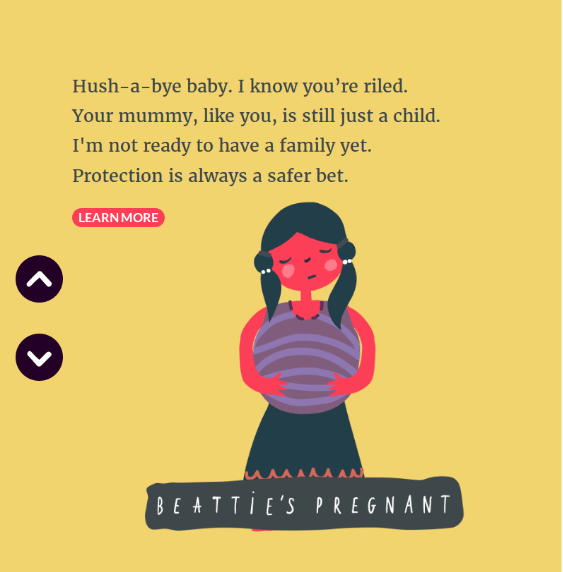
Beattie’s pregnant.
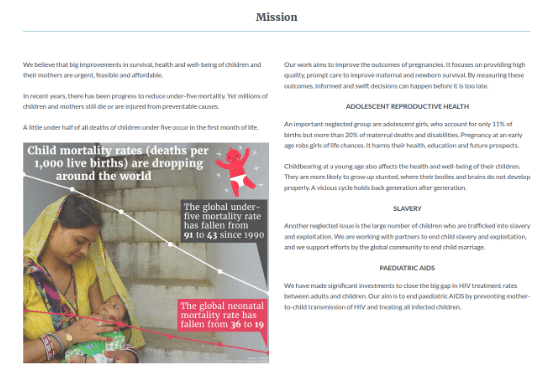
Beside this on the screen you will see the data itself, one of the larger datasets we had access to in creating the interactive. It is still fairly simple, laying out the percentage of adolescent girls reporting first births across West and Central Africa, East and Southern Africa, South Asia, Latin America and the Caribbean, Arab States, East Asia and Pacific, Eastern Europe and Central Asia.
This is the screen showing the results of teen pregnancies before the age of 18 in those regions.
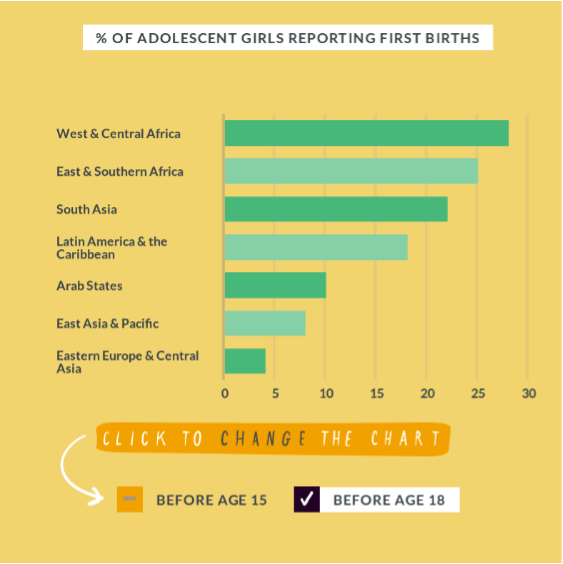
% of adolescent girls reporting their first birth before the age of 18.
Let’s break down the data for a second. As you can see in this vertical bar chart, West and Central Africa experience high proportions of teen pregnancy, close to 30%.
The combined population of this region is estimated at 473 million, which means that region has over 132 million teen mothers.
Adolescent pregnancies and births are problematic for a variety of reasons. Collectively, adolescent mothers account for 11% of births but more than 20% of maternal deaths and disabilities. Pregnancy at an early age has a negative trickle down effect to both the mothers (in terms of health, education, future prospects) and their children (more prone to stunted growth and development).
You can also click the button at the bottom of the screen to swap out this data for percentages of girls reporting their first birth by the age of 15.
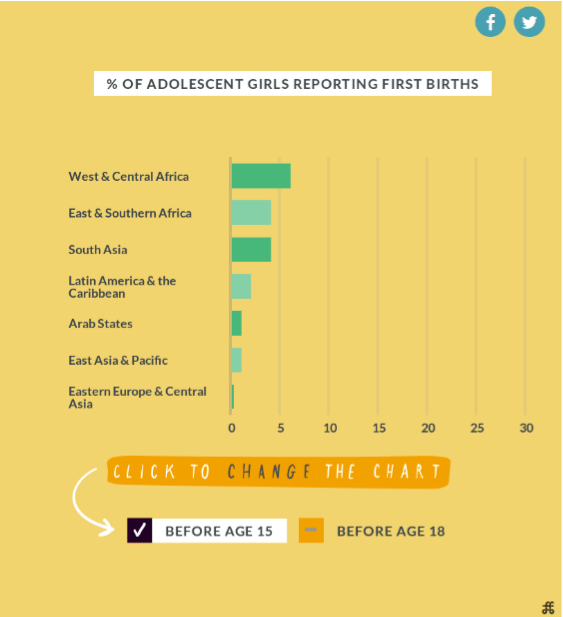
% of adolescent girls reporting their first birth before the age of 15.
The numbers are obviously lower than in the previous dataset, however this still represents millions of girls and young women worldwide.
If you click on the “learn more” button on the Beattie panel, it will give you some context around this issue…
Users can click through to the report here.
… and then take you through to CIFF’s full reports, with details about their mission and the impact of their investments.
CIFF’s report.
INTERACTIVITY
The interactive elements of this project were really interesting to create. We wanted them to be simple, but unexpected.
This panel, for example, deals with the effect of climate change.
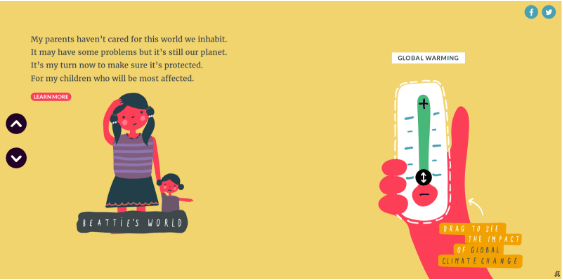
Beattie’s worried about climate change.
And here’s what happens when you turn up the dial on global warming using the slider on the right:
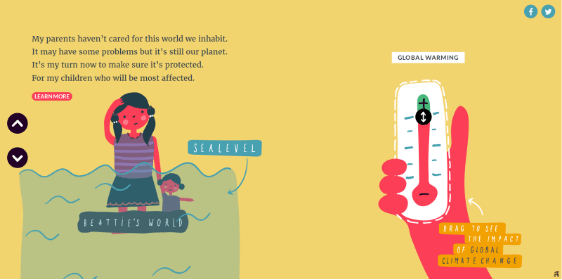
Check out that sea level. Ruh roh.
Something we learned during this project (and other projects like it) is that the key to using small data is creating a relevance to the end user. Small data is personal and relatable, and the ways in which we visualize this data should logically follow that.
You can check out the final interactive, called Beattie’s Story, here.
IMPACT
In the four months since the launch, Beattie’s Story has had close to 7,000 visits and shares from high profile figures including the Gates Foundation, FAO, UN Foundation, UNICEF and World Bank Health.
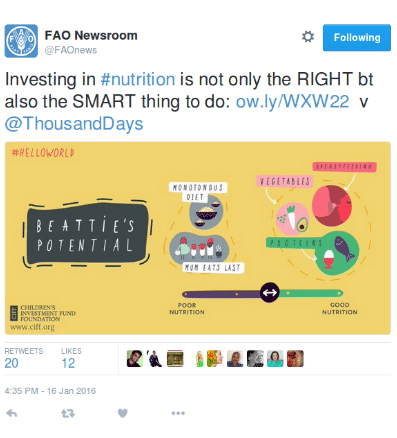
A tweet from FAO highlighting the connection between childhood nutrition and lifelong health in Beattie’s Story.
CIFF decided to promote a hashtag in rolling out their campaign around Beattie’s Story – #HelloWorld.
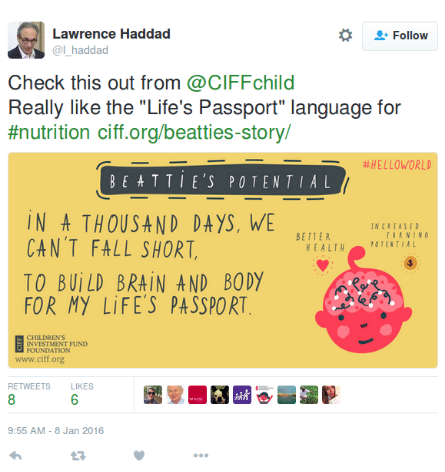
A tweet from Lawrence Haddad, Senior Research Fellow at IFPRI and a champion of efforts to end malnutrition.
Four months post-launch, Beattie has become a protagonist in all of CIFF’s communications: on their website, at events, within their office environment, and in social media activity.
Says Matt Gould, digital manager of CIFF: “She’s one of our greatest digital spokespeople.”
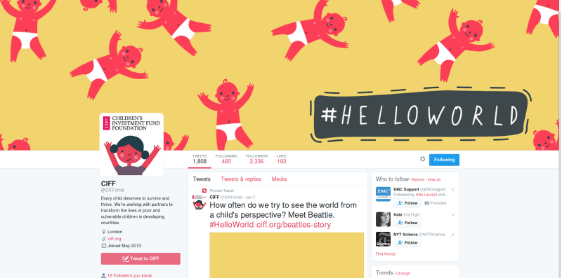
CIFF’s Twitter profile, loaded with the Beattie identity.
“The greatest impact we’ve seen is exactly what we were hoping for—making a stronger connection between the work of our grantees and improving the lives of children. We exist to champion children—to make sure that every child has the opportunity to survive and thrive. Through Beattie, we’re able to tell that story in a compelling and engaging way.”
“Development work is often buried under miles of technical jargon, and conversation only happens between a small group. Beattie’s story is a way to break out of that echo chamber, making the issues real for the reader.”
To learn more about FFunction and their work, visit their website here.
To stay up to date with the latest Markets For Good articles and news, sign up to our newsletter here. Make sure that you are also following us on Twitter.